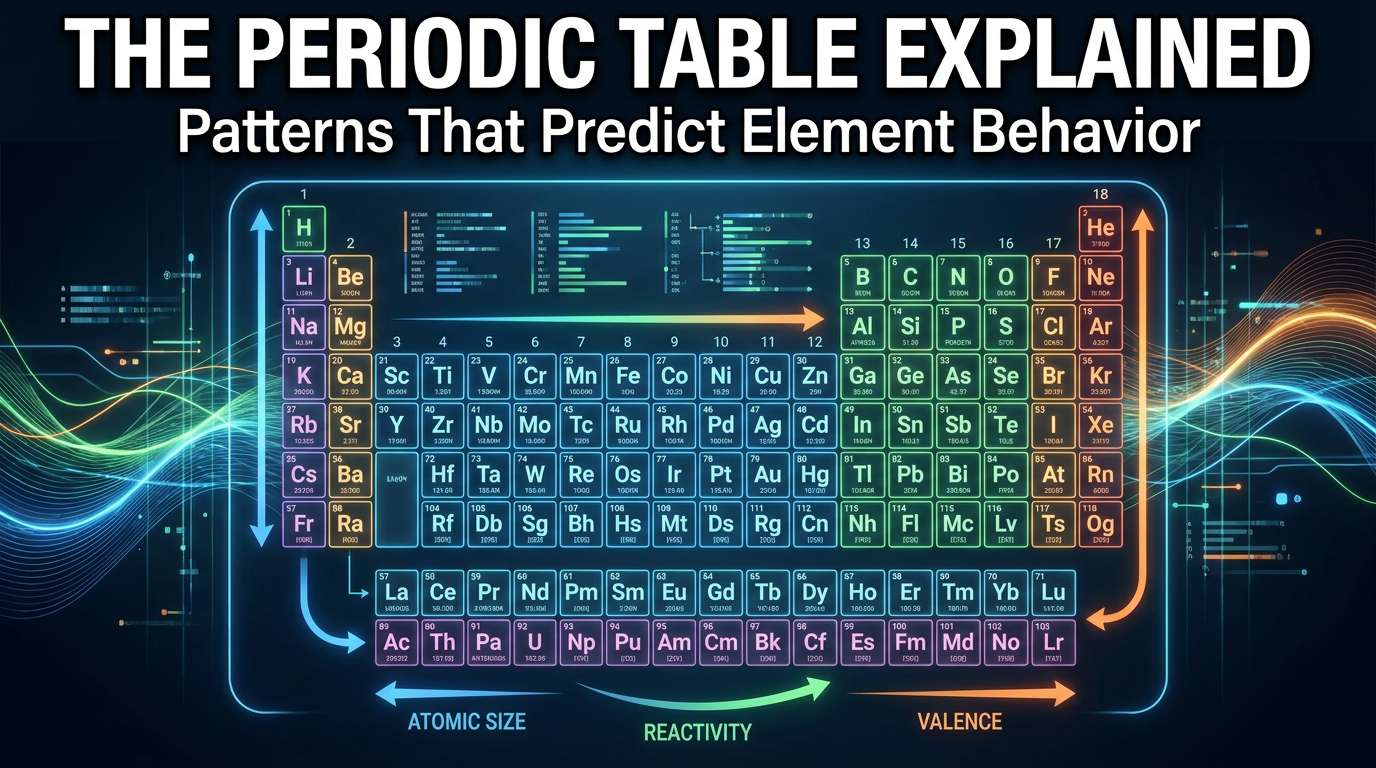
The Periodic Table Explained: Patterns That Predict Element Behavior
Introduction
Hanging on the wall of nearly every chemistry classroom is a grid of coloured boxes, each containing a symbol, a number, and a name. To the untrained eye, it looks like a reference chart — a list to memorise. But the periodic table is something far more powerful: a map of hidden logic so precise that a 19th-century chemist used it to predict the existence of elements that had not yet been discovered — and got their properties almost exactly right.
Once you understand how the periodic table is built, you stop seeing 118 unrelated elements and start seeing one unified, predictable system. You can look at an element's position and immediately know how large its atoms are, how easily it reacts, and what kind of bonds it is likely to form — all before ever touching it in a laboratory.
A Brief History: Mendeleev's Bold Prediction
In 1869, the Russian chemist Dmitri Mendeleev published the first widely accepted version of the periodic table, arranging the known elements in order of increasing atomic mass.1 Mendeleev noticed that when arranged this way, elements with similar properties recurred at regular intervals — a pattern he called periodicity.2
What made Mendeleev's table extraordinary was not just what it included, but what it left out. He deliberately left empty spaces in his table, confident that undiscovered elements existed to fill them.2 Using the patterns in his table, Mendeleev predicted the existence and properties of three unknown elements — later discovered and named gallium, scandium, and germanium — and his predictions matched the real elements with striking accuracy.2
From Atomic Mass to Atomic Number
Mendeleev's original table wasn't perfect. Because it was organised by atomic mass, it produced a few anomalies and awkward placements for certain elements.3 In the early 20th century, the English physicist Henry Moseley discovered that arranging elements by atomic number — the number of protons in an atom's nucleus — resolved these problems and produced a far more accurate and consistent table.1 This atomic-number arrangement is the modern periodic table used today.
How the Modern Periodic Table Is Organised
The modern periodic table arranges all known elements into rows called periods and columns called groups, ordered by increasing atomic number.4
Periods (Rows)
There are seven periods in the periodic table, and each one represents a new electron energy level, or shell, being filled.5 As you move from left to right across a period, elements steadily transition from metals to metalloids to non-metals.5
Groups (Columns)
There are 18 groups in the modern periodic table.5 Elements within the same group share the same number of valence electrons — the electrons in the outermost shell — which is why elements in the same group display strikingly similar chemical and physical properties.4 This is the single most important organising principle of the entire table: position in a group tells you how an element is likely to behave chemically.
Metals, Non-Metals, and Metalloids
Broadly, metals occupy the left and centre of the table, non-metals occupy the right, and metalloids — elements with intermediate properties — sit along the zig-zag line that separates the two.4
Periodic Trends: The Predictive Power of Position
Because properties change in regular, predictable patterns across periods and down groups, chemists can often predict how an element will behave simply by knowing where it sits on the table. These predictable patterns are called periodic trends.6
Atomic Radius
Atomic radius — the size of an atom — decreases across a period from left to right, and increases down a group.7
- Across a period: as atomic number increases, the number of protons in the nucleus increases, pulling the outer electrons in more tightly and shrinking the atom.8
- Down a group: each successive element has an additional filled electron shell, pushing the outermost electrons further from the nucleus and increasing atomic size.8
As a result, elements in the lower left corner of the periodic table have the largest atomic radii, while elements in the upper right have the smallest.9
Ionisation Energy
Ionisation energy is the amount of energy required to remove one electron from an isolated atom in the gas phase.10 It increases across a period, because the growing nuclear charge holds electrons more tightly, and decreases down a group, because outer electrons are further from the nucleus and more easily removed.7 Elements in the upper right corner of the table — the noble gases and halogens — therefore have the highest ionisation energies.9
Electronegativity
Electronegativity describes an atom's tendency to attract shared electrons toward itself when bonded to another atom.11 Like ionisation energy, electronegativity increases across a period and decreases down a group.7 The most widely used electronegativity scale was devised by the chemist Linus Pauling, and on this scale, fluorine — found in the upper right of the table — is the most electronegative element of all.2
Metallic Character
Metallic character — the tendency of an element to lose electrons and behave like a typical metal — follows the opposite pattern to electronegativity: it decreases across a period and increases down a group.7 This is why the most reactive metals, such as caesium and francium, sit in the lower left of the table, while the least metallic elements sit in the upper right.
Why These Trends Exist: The Underlying Cause
All periodic trends trace back to two competing factors:
- Nuclear charge: more protons pull electrons in more strongly, shrinking atomic size and increasing ionisation energy and electronegativity.
- Electron shielding and shell number: as more electron shells are added down a group, outer electrons are shielded from the nucleus by inner electrons and sit further away, reducing the nucleus's pull on them.
Every periodic trend is essentially a story about the tug-of-war between these two forces — which is why moving across a period behaves so differently from moving down a group.
Using the Periodic Table to Predict Reactivity
Reactivity does not increase or decrease in one single direction across the whole table — it depends on whether an element is a metal or a non-metal.7
- Metals become more reactive down a group, since their outer electrons are held more loosely and are more easily lost.7
- Non-metals become more reactive up a group, since their outer shells are closer to the nucleus and more strongly attract additional electrons.7
This is why, for example, francium (bottom of Group 1) is dramatically more reactive than lithium (top of Group 1), while fluorine (top of Group 17) is dramatically more reactive than iodine (bottom of Group 17).
The Periodic Table and WAEC/JAMB Chemistry
- Structure of the periodic table: Identifying groups, periods, and the classification of elements as metals, non-metals, and metalloids.
- Electronic configuration: Relating an element's group number to its number of valence electrons, and its period number to its number of electron shells.
- Periodic trends: Explaining and applying trends in atomic radius, ionisation energy, and electronegativity across periods and down groups — a frequently examined topic.
- Reactivity trends: Comparing the reactivity of metals within Group 1 or 2, and non-metals within Group 17, using position on the table.
- Historical development: Understanding why the modern table (based on atomic number) replaced Mendeleev's original table (based on atomic mass) is a common short-answer topic.
Common Mistakes Students Make
- Confusing groups and periods. Groups are vertical columns; periods are horizontal rows. Mixing these up is one of the most frequent errors in examinations.
- Assuming all trends increase in the same direction. Atomic radius decreases across a period, while ionisation energy and electronegativity increase across the same period — these trends move in opposite directions and must not be confused.
- Forgetting that metal and non-metal reactivity trends are reversed. Metals get more reactive going down a group; non-metals get more reactive going up a group. Applying the wrong direction is a very common mistake.
- Believing atomic mass, not atomic number, defines the modern table's order. The modern periodic table is arranged strictly by atomic number, which resolved several anomalies present in Mendeleev's original mass-based arrangement.
Conclusion
The periodic table is not a static list to be memorised line by line — it is a living map of atomic structure, built from a pattern so reliable that Mendeleev used it to describe elements he had never seen. Every column groups atoms with matching outer electrons; every row represents a new electron shell being filled; and every trend in atomic radius, ionisation energy, and electronegativity flows directly from the balance between nuclear charge and electron shielding.
Once these patterns click into place, the periodic table stops being 118 separate facts to memorise and becomes what it always was: one of the most powerful predictive tools ever created in science.